User Research
UX Research ROI: How to Connect Usability Testing to Business Outcomes
UX research ROI: UX teams lose influence when they report activity instead of impact. Learn how to connect usability testing, product research, and roadmap validation to revenue, cost, risk, speed, and retention.
Why UX teams lose budget conversations
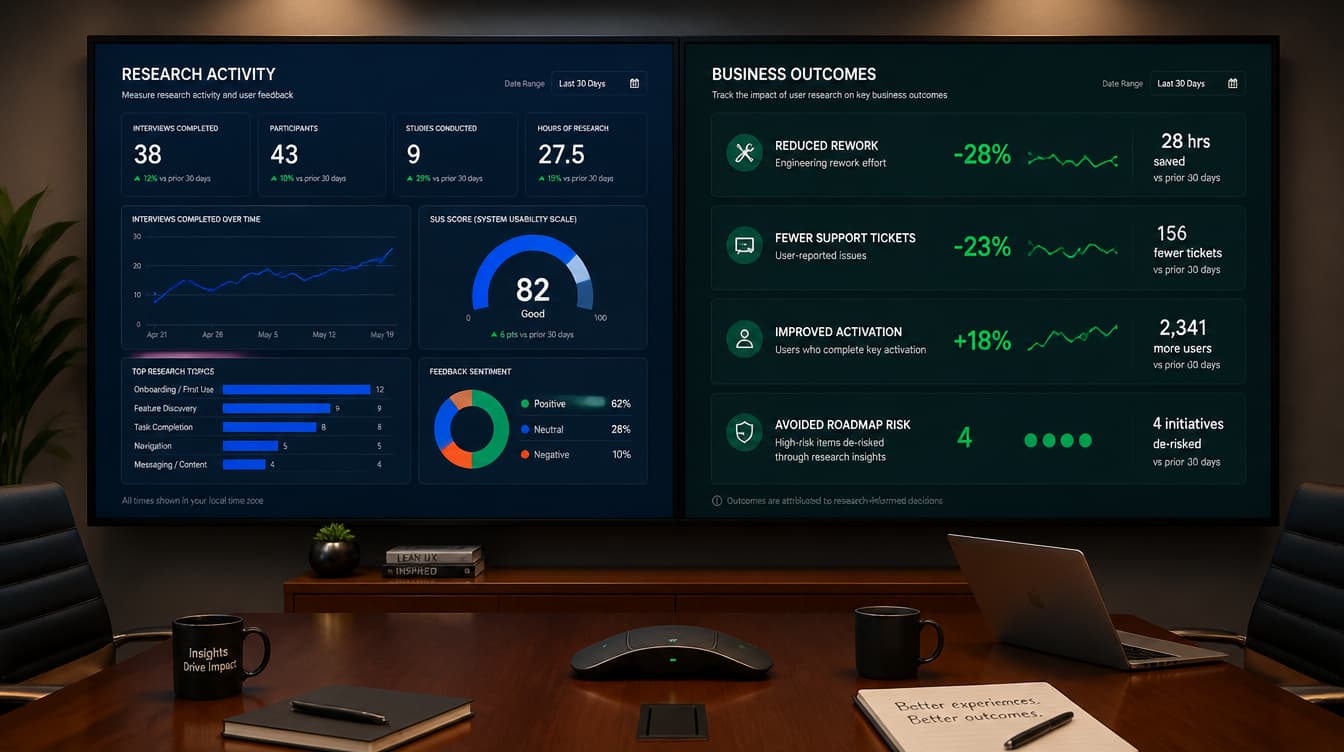
UX research does not usually fail because it lacks value. It fails politically because its value is reported in a language leadership does not use to allocate resources. A team can run excellent usability tests, conduct high-quality interviews, synthesize themes carefully, and still lose influence if the final report only says what the research team did. In budget conversations, activity is not impact. Activity consumes resources. Impact explains why those resources were worth spending.
Nielsen Norman Group published a direct version of this argument in July 2026: UX teams should report business outcomes, not UX activity or isolated UX metrics, if they want to show impact on revenue, cost, risk, speed, retention, and secure resources. The article’s core warning is blunt. Research teams that cannot connect work to business outcomes risk being categorized as cost centers.
This is a useful correction for any team trying to defend research in 2026. The current market is not forgiving. User Interviews’ 2025 Research Budget Report found that headcount, tools, and participant recruitment account for the majority of research budgets, and that only 17 percent of surveyed participants said their research budget had shrunk. That is not a collapse, but it is not unconditional security either. The same report found that budget satisfaction and perceived impact vary, and that the C-suite still holds the purse strings for many organizations.
Activity metrics versus decision impact
The implication is clear: research teams need to become better at showing how evidence changes product and business decisions. We ran 24 interviews is not enough. We improved task success by 18 percent is better, but still incomplete if leadership does not understand how that affects revenue, cost, risk, speed, or retention. The strongest version is: we identified a critical onboarding failure before launch, changed the flow, reduced expected support demand, and de-risked the activation target for the next release.
That sentence works because it translates research into business movement. It does not abandon research rigor. It connects rigor to the decisions executives are paid to make.
The five business outcomes leaders already understand
Revenue
The first business outcome is revenue. UX research supports revenue when it identifies friction that prevents users from buying, activating, upgrading, or adopting a feature. In a SaaS product, that friction might be a signup flow that confuses buyers, a pricing page that fails to explain value, a trial onboarding sequence that hides the first meaningful action, or an enterprise workflow that blocks team rollout. A usability test does not directly create revenue. But it can expose the mechanism suppressing conversion or expansion.
Cost reduction
The second outcome is cost reduction. Poor UX creates operational cost. Confusing interfaces increase support tickets. Broken onboarding increases customer success workload. Ambiguous forms create reprocessing. Misunderstood instructions generate failure demand, which means demand caused by the system failing the user rather than by genuine user need. Usability testing is valuable because it catches those problems before they are pushed into support, customer success, QA, and engineering rework.
Risk mitigation
The third outcome is risk mitigation. Risk is often the strongest business case for research because the downside of a bad decision is easier to explain than the upside of a good one. A misunderstood financial form, a medical workflow error, a privacy consent failure, or a misleading enterprise dashboard can create compliance, legal, reputational, or operational exposure. Even in lower-stakes products, building the wrong feature is a risk because it consumes engineering capacity that could have been used elsewhere. Nielsen Norman Group explicitly frames UX work that surfaces design-caused failures before launch as risk mitigation.
Speed to market
The fourth outcome is speed to market. This is where UX is often misunderstood. Weak organizations treat research as delay. Strong organizations use research to reduce rework. A one-week usability study before development can prevent three sprints of engineering changes after launch. A five-participant test on a prototype can reveal the information architecture problem before the team commits to front-end implementation. The time saved is not only calendar time. It is reduced context switching, fewer emergency patches, less QA churn, and less political noise after a failed release.
Retention and satisfaction
The fifth outcome is retention and satisfaction. If users fail to reach value, they leave. If they cannot complete setup, they do not become activated. If they do not understand why a feature matters, they ignore it. Usability testing, first-click testing, tree testing, card sorting, and five-second testing all help teams detect whether users understand, find, trust, and complete what the product needs them to do. The business link is strongest when research is connected to downstream product metrics such as activation rate, feature adoption, support contact volume, churn, renewal risk, or expansion readiness.
How usability testing maps to business value
The problem is that many UX reports stop one step too early. They describe the user problem but not the business implication. They say, participants struggled to find account settings. That is useful, but incomplete. The business version says, participants struggled to find account settings, which creates avoidable support demand and may block self-service account administration for enterprise teams. The second sentence helps a Product Manager prioritize because it connects the usability issue to operational cost and enterprise readiness.
Why roadmap validation is the strongest ROI story
The same applies to roadmap validation. Product teams often ask research to validate a feature after a solution has already been selected. That is late. The stronger move is to validate the decision before the roadmap hardens. Before building a feature, the team should know which user segment has the problem, how often it occurs, how severe it is, what users do today, what alternatives they use, what success would look like, and what risk the company carries if it builds the wrong thing.
Roadmap validation is where UX research ROI becomes most defensible. The avoided cost of building the wrong thing can be enormous. Engineering capacity is expensive. More importantly, roadmap capacity is finite. Every feature added to a roadmap displaces another possible feature. If research helps a team kill a weak idea, narrow a bloated requirement, or identify the smallest valuable version, it has created measurable strategic value even before a line of code is written.
The measurement bridge from research signal to business outcome
This is why product teams need a measurement bridge. The bridge connects four layers: research signal, product decision, product metric, and business outcome. The research signal might be failed task completion, repeated confusion, unmet need, low willingness to switch, or strong evidence of a workaround. The product decision might be simplify onboarding, change navigation, pause the feature, revise the pricing message, or run another experiment. The product metric might be activation, adoption, conversion, support volume, or retention. The business outcome might be revenue protection, cost reduction, risk mitigation, faster release, or improved renewal probability.
Without this bridge, UX research becomes a collection of interesting observations. With the bridge, it becomes an evidence system for product decision-making.
A good report should therefore include two layers of metrics. Upstream metrics explain what happened in the study: task success rate, error rate, time on task, SEQ, SUS, comprehension, first-click success, path success, confidence, sentiment, or qualitative severity. Downstream metrics explain what the team expects to change in the product or business: fewer support contacts, better activation, higher feature discovery, lower onboarding abandonment, fewer post-launch fixes, lower compliance exposure, better retention. Nielsen Norman Group makes this upstream versus downstream distinction explicitly and argues that downstream metrics explain what the work was worth. S
This does not mean researchers should fake attribution. That would be a mistake. UX work often contributes to outcomes alongside engineering, product, marketing, customer success, and pricing. The honest claim is not always direct causality. Sometimes it is risk reduction, decision support, or contribution to a measurable change. A mature research report should distinguish between observed evidence, plausible business implication, and verified business result. That distinction increases credibility.
Reporting templates that change stakeholder behavior
Here is a practical reporting model:
First, state the decision. Example: Should we ship the new onboarding checklist in the next sprint? This keeps the report from becoming a general findings document.
Second, state the evidence. Example: Four of six participants failed to understand the difference between account setup and workspace setup. Three expected the checklist to show progress toward inviting teammates. This grounds the claim in observed behavior.
Third, state the product implication. Example: The current checklist risks incomplete setup because users think they are done before team configuration is complete.
Fourth, state the business risk. Example: Incomplete setup could suppress team activation and increase customer success intervention during the trial period.
Fifth, state the recommendation. Example: Ship only after changing checklist labels, making team setup visible, and retesting the first-use flow with target users.
Sixth, state the confidence level. Example: Confidence: medium. The issue was repeated across participants, but the sample did not include enterprise admins.
Seventh, state the follow-up metric. Example: After launch, track checklist completion, teammate invitations, activation within seven days, and setup-related support contacts.
This format changes how stakeholders use research. It forces the team to see research as input to a decision, not as a parallel documentation exercise. It also makes the report easier to defend in planning meetings because each recommendation is tied to a risk or expected business movement.
There is also a cultural benefit. When UX teams report outcomes, Product Managers stop treating research as an optional validation step. Engineering leaders start seeing research as a way to reduce rework. Founders start seeing research as a way to allocate scarce capacity. Customer success leaders see research as a way to reduce repeated user confusion. Executives see research as a way to reduce uncertainty before committing resources.
Fred positioning implications
For Fred, this is central to positioning. A generic UX research tool helps teams collect feedback. A stronger platform helps teams turn feedback into decisions. The phrase decision intelligence should not be decorative. It should describe the system’s output: a structured connection between evidence, confidence, recommendation, and business implication. Fred’s reporting should make this connection explicit every time.
Fred can also differentiate by treating behavioral and emotional signals as decision context rather than vanity metrics. A moment of hesitation in a usability test is not valuable because it looks interesting in a video clip. It is valuable if it explains where the user’s mental model breaks. Prosody or frustration signals are not valuable because they create a dramatic report. They are valuable when they help identify severity, uncertainty, and the difference between a minor preference and a real adoption blocker. This distinction matters because the market is becoming skeptical of AI-generated polish. Fred should be positioned as evidence control, not insight theater.
The strongest marketing message is not run more research. It is make better product decisions with less avoidable risk. That message speaks to Product Managers, Heads of Product, founders, and enterprise buyers. It also respects the research craft. Researchers do not need their work reduced to dashboards. They need tools that preserve evidence quality while making the decision impact visible.
A practical Fred report should therefore answer five stakeholder questions. What decision are we making? What did users actually do or say? What risk did we uncover? What should change before we commit more resources? How confident are we? If every report answers those questions, Fred will not just compete in the research-tool category. It will compete in the higher-value category of product decision infrastructure.
Conclusion
The trend is clear. UX teams are under pressure to prove relevance. Research budgets are not disappearing everywhere, but they require stronger justification. AI is accelerating analysis, but it also increases the risk of polished outputs that lack business consequence. Product teams are moving too fast to absorb long findings decks. The solution is not less research. It is sharper research reporting.
UX research ROI is not a formula hidden in a spreadsheet. It is the disciplined practice of connecting user evidence to decisions that change revenue, cost, risk, speed, retention, or satisfaction. Usability testing has always had that potential. The teams that win now will be the ones that make the connection visible before stakeholders ask for it.
Turn research evidence into decision-ready reports with Fred
Use Fred to turn usability evidence into decision-ready reports that show what changed, why it matters, and which product risk was reduced. Try it with a 15-day free trial. Start your 15-day free trial →
Source notes
- Nielsen Norman Group, Stop Reporting UX Activity and Report Business Outcomes: https://www.nngroup.com/articles/reporting-ux-business-outcomes/
- User Interviews, The 2025 Research Budget Report: https://www.userinterviews.com/research-budget-report
- User Interviews, The State of User Research Report 2025: https://www.userinterviews.com/state-of-user-research-report
- User Interviews, The 2026 UX Salary Report: https://www.userinterviews.com/ux-salary-report
- Nielsen Norman Group, Your New UX Habit: Establishing Baselines for Impact: https://www.nngroup.com/articles/